Transport Open Data in 2023
, .
If you prefer more pictures and fewer words, this blog post is based on this twitter thread.
In 2017, with colleagues at Open Innovations, we started tracking every bus on major routes within the West Midlands. Analysis of that data showed that,
- Birmingham’s effective population density (the number of people who can reach the city centre by public transport within a certain time) is much smaller than we’d expect from its physical population density.
- Birmingham’s effective population density by this definition shrinks even further at peak times when roads become congested and slow down buses, the main form of public transport in the city.
- Birmingham’s competitor cities across Europe do not experience similar reductions in effective population density because they have far more separated public transport (bus lanes, tram lines, metros) and often much more efficient ticketing systems that get people onto and off of buses much more quickly.
- Birmingham’s reduced effective size could explain up to 100% of its productivity (GVA/resident) shortfall of 33% with respect to similarly sized French cities. A more reasonable estimate based on comparisons to a wider selection of cities in Europe is that it costs about a third of the productivity shortfall.
This data has since been used within Birmingham to improve bus speeds by interventions such as adding bus lanes and removing overly-close bus stops. It has also been used to make business cases for more substantial investments such as bus rapid transit, railway station re-openings, and tram extensions.
Centre for Cities have done excellent similar work expanding this methodology to a large number of cities in the UK and Europe. But importantly they are restricted to comparing public transport timetables and not data on what vehicles actually ran and at what speed. As our data has shown in Birmingham, public transport systems that rely on buses that mix with traffic fail badly to meet their timetabled performance.
Now can we do it for everywhere?
My experiences of working with Birmingham city council, Transport for the West Midlands, local bus companies, and other local transport bodies around the UK on this project were consistently excellent and efficient. Some interactions with national bodies and the UK government were less impressive.
People working in and with local government almost always asked how this data was being used to improve public transport and stimulate economic growth in the West Midlands and how they could learn from that. People working in and with central government often asked when the tool would be available nationally and little more. Without national comparison, they argued, investment in improvements in Birmingham might be of lower value than alternatives and thus shouldn’t be a priority until that could be disproved.
I find this attitude deeply frustrating, but I know that many Britons, and probably most English, find it sensible. So I’ve been working on extending my work to the whole of England ever since. In the end I got Wales and Scotland too, but not Northern Ireland. Sorry.
As a rule of thumb, working with data at national scale is at least ten times more difficult than working with data at a local scale. The inefficiencies of scale in data analysis can be enormous. And in this case we've had the added challenge that our work in Birmingham was enabled by innovations in the West Midlands that they were able to deploy five years ahead of the UK government by working outside of national systems and standards. But we have made progress thanks in particular to,
- The Entur AS team in Norway who have made huge improvements to Open Trip Planner, allowing it to analyse public transport networks at the whole-England scale. Without the release of OTP2.2 in November 2022 which included the Travel Time API we could not have made the current progress. We will be using other improvements in OTP 2.2 to simplify and accelerate our previous work on transport accessibility across North England.
- The teams at The Department for Transport and ITOWorld who have created The Bus Open Data Service which now provides GTFS-format timetables for all public transport except trains for the whole of Great Britain and which provides live bus location data for the whole of Great Britain except London with bus identifiers that match to those timetables.
- Google, for their continued leadership encouraging the adoption of GTFS timetables for public transport all around the world. This increasingly is enabling us to compare public transport efficiency across cities across countries, which I have analysed for Leeds, Lille, and Dublin already.
- Continued improvements to QGIS, open source GIS software, which has enabled significantly more reliable and powerful analyses since late 2019.
- Improvements in technology since 2017. Today a laptop with 64GB of RAM and a 4TB SSD is within most people’s budget and improvements to software performance (most relevant to me, .NET) mean that computation is far faster even if CPU performance has not improved by much.
So what are the results?
Timetables and what really ran.
On 6 December 2022 I tracked every bus in Great Britain for three hours. This produced a large but manageable 2GB of data. For the same day I downloaded the Great Britain bus timetable in GTFS format.
Focusing just on Leeds and Bristol I matched every bus that ran to its timetable and produced a version of the Great Britain bus timetable in GTFS format reflecting only those buses that ran and their recorded positions every minute.
I loaded the GTFS files representing the real bus movements and timetabled bus movements into Open Trip Planner 2.2 and using the Isochrone feature I calculated the reachable area of Leeds from the Corn Exchange within 45 minutes with only walking and taking the bus as allowed methods of travel.
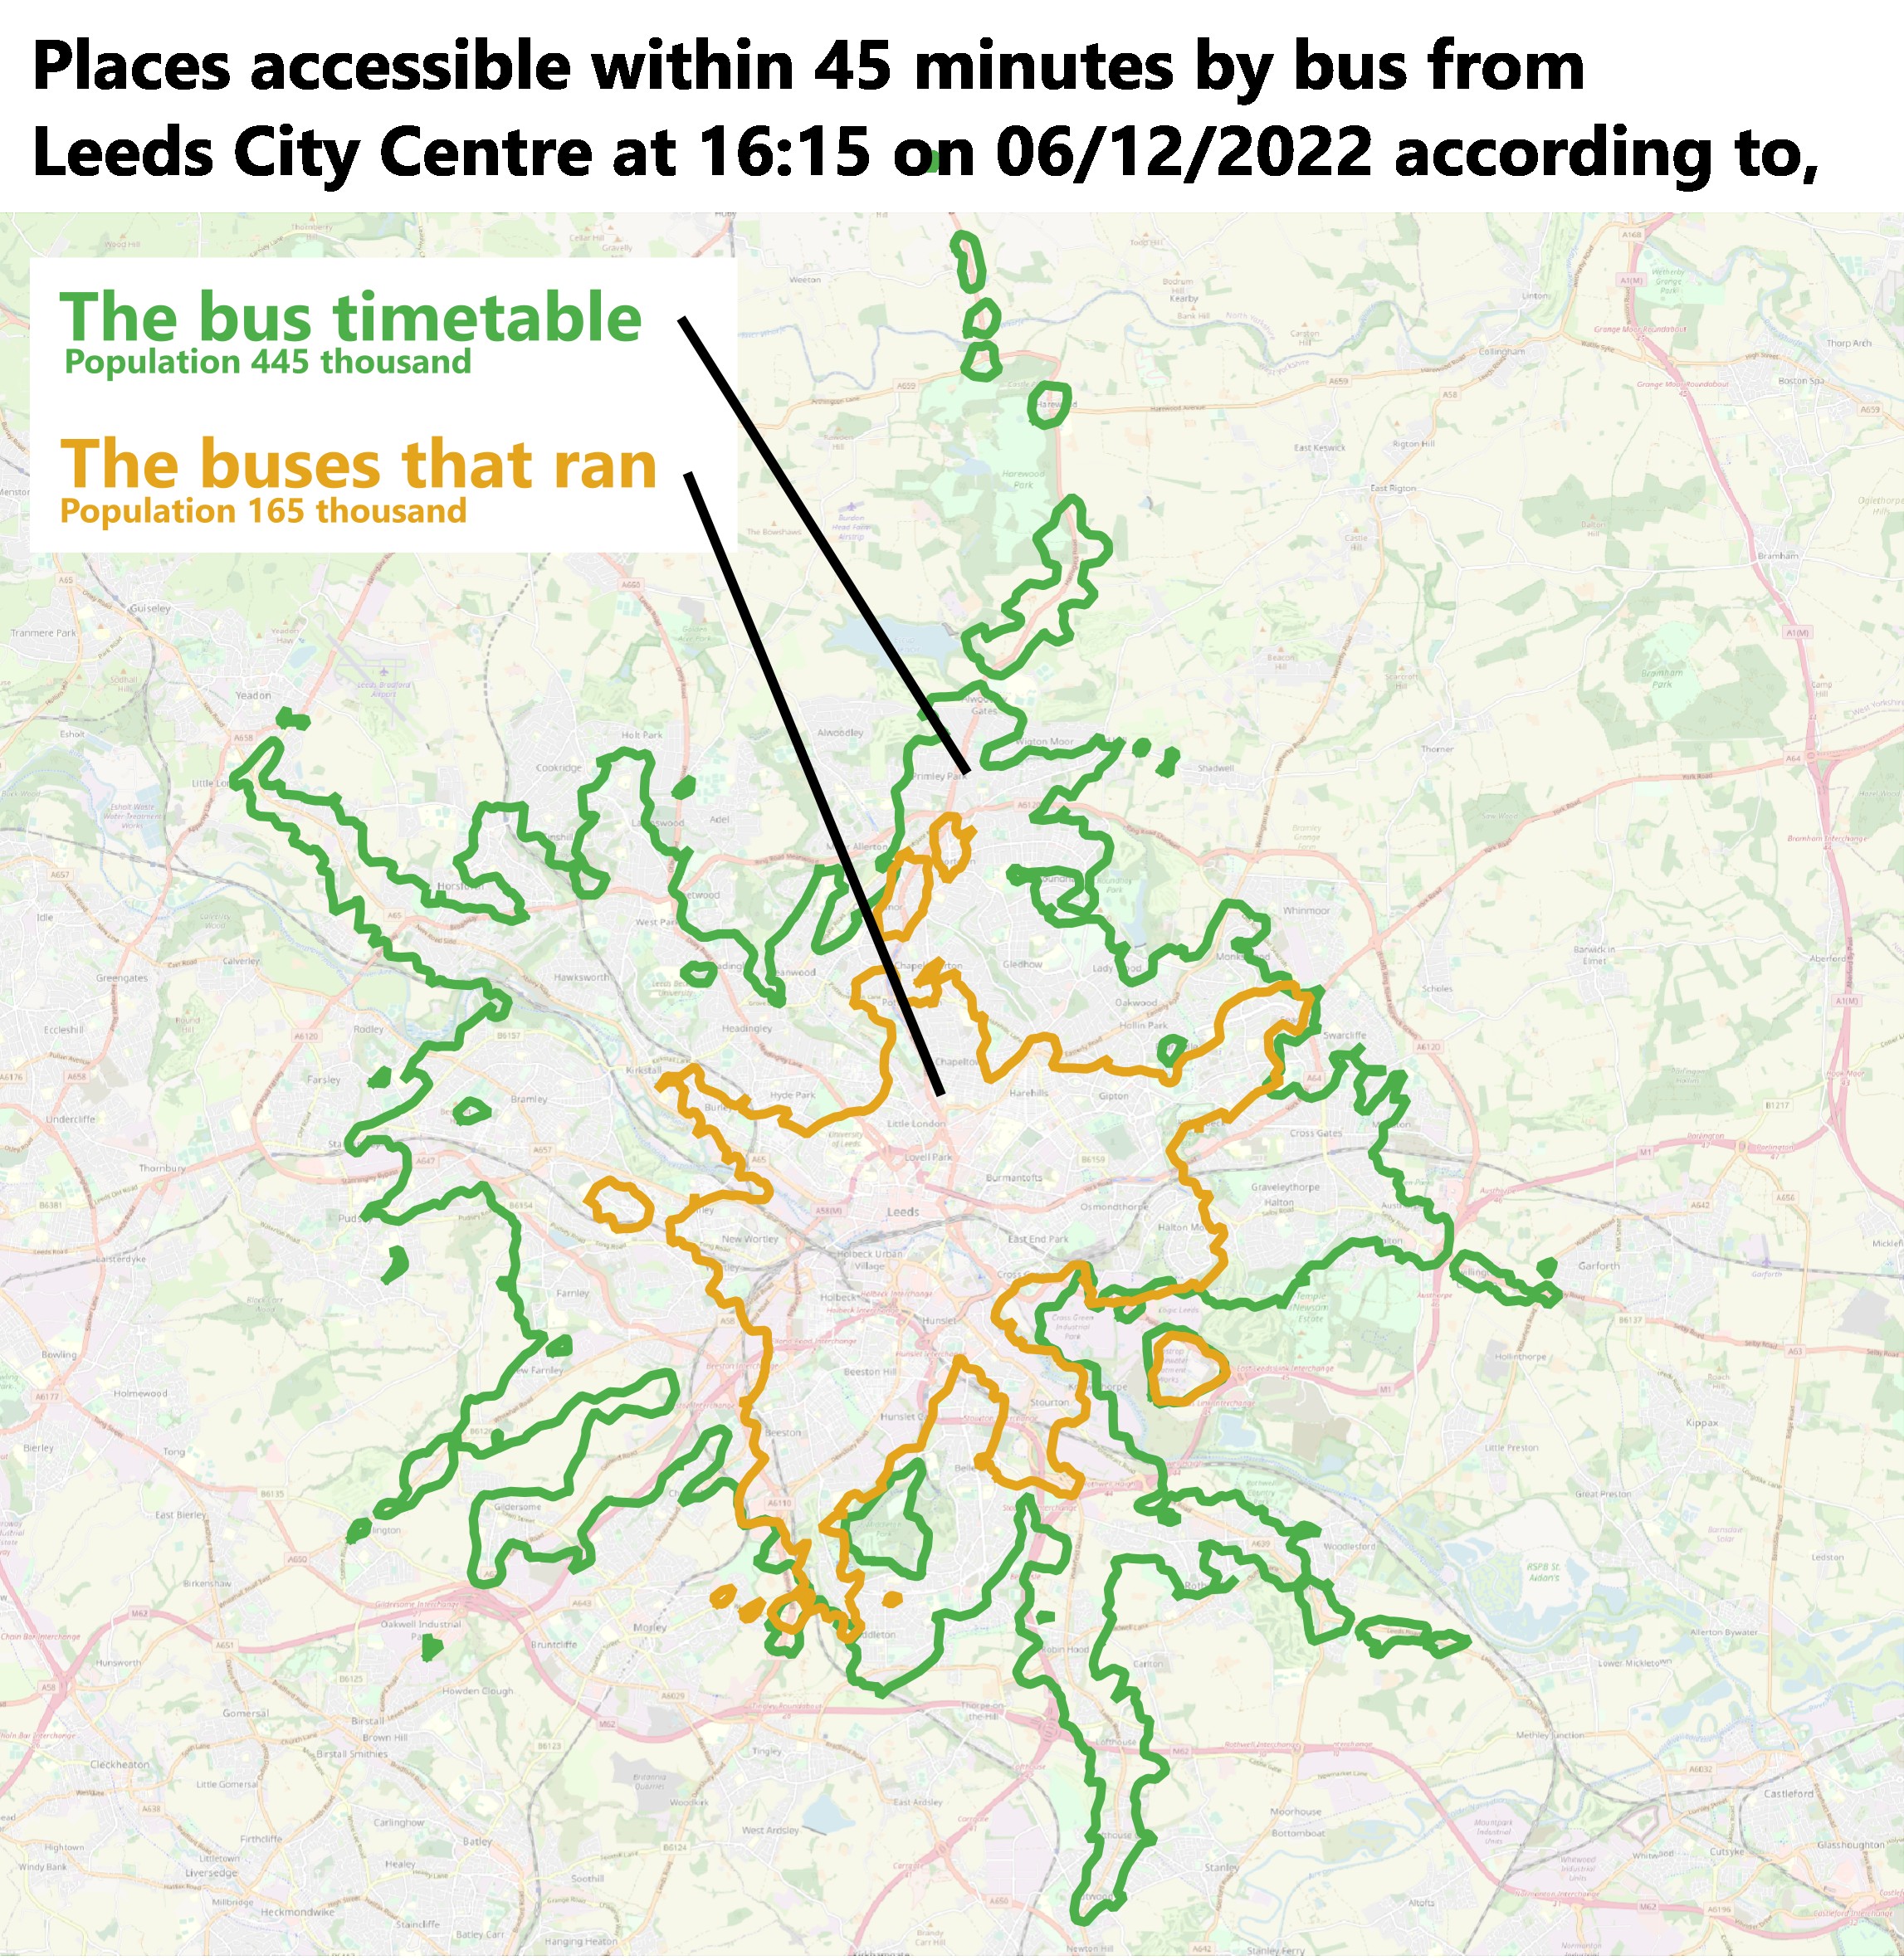
We see clearly that in reality the accessibility of Leeds by bus is nowhere near that suggested by the timetable.
More accurate effective population estimates.
As part of this work, we’ve been developing tools for comparing population and public transport networks internationally. I have made a web version of those tools that works just for circles.
Behind the scenes, and not available via that website, we can calculate comparable population estimates for any polygon, including the two accessibility polygons for Leeds. Using this tool we show that the population within 45 minutes of central Leeds by bus on a typical December late afternoon is,
- 445 thousand according to the bus timetable.
- 165 thousand according to the buses that ran and the speed that they ran at.
This is an even larger reduction in effective size than our previous work has shown in Birmingham. We suspect that this is because Leeds has no tram, our work does not currently consider trains, and because congestion was particularly bad on this day due to Christmas shopping and ongoing roadworks.
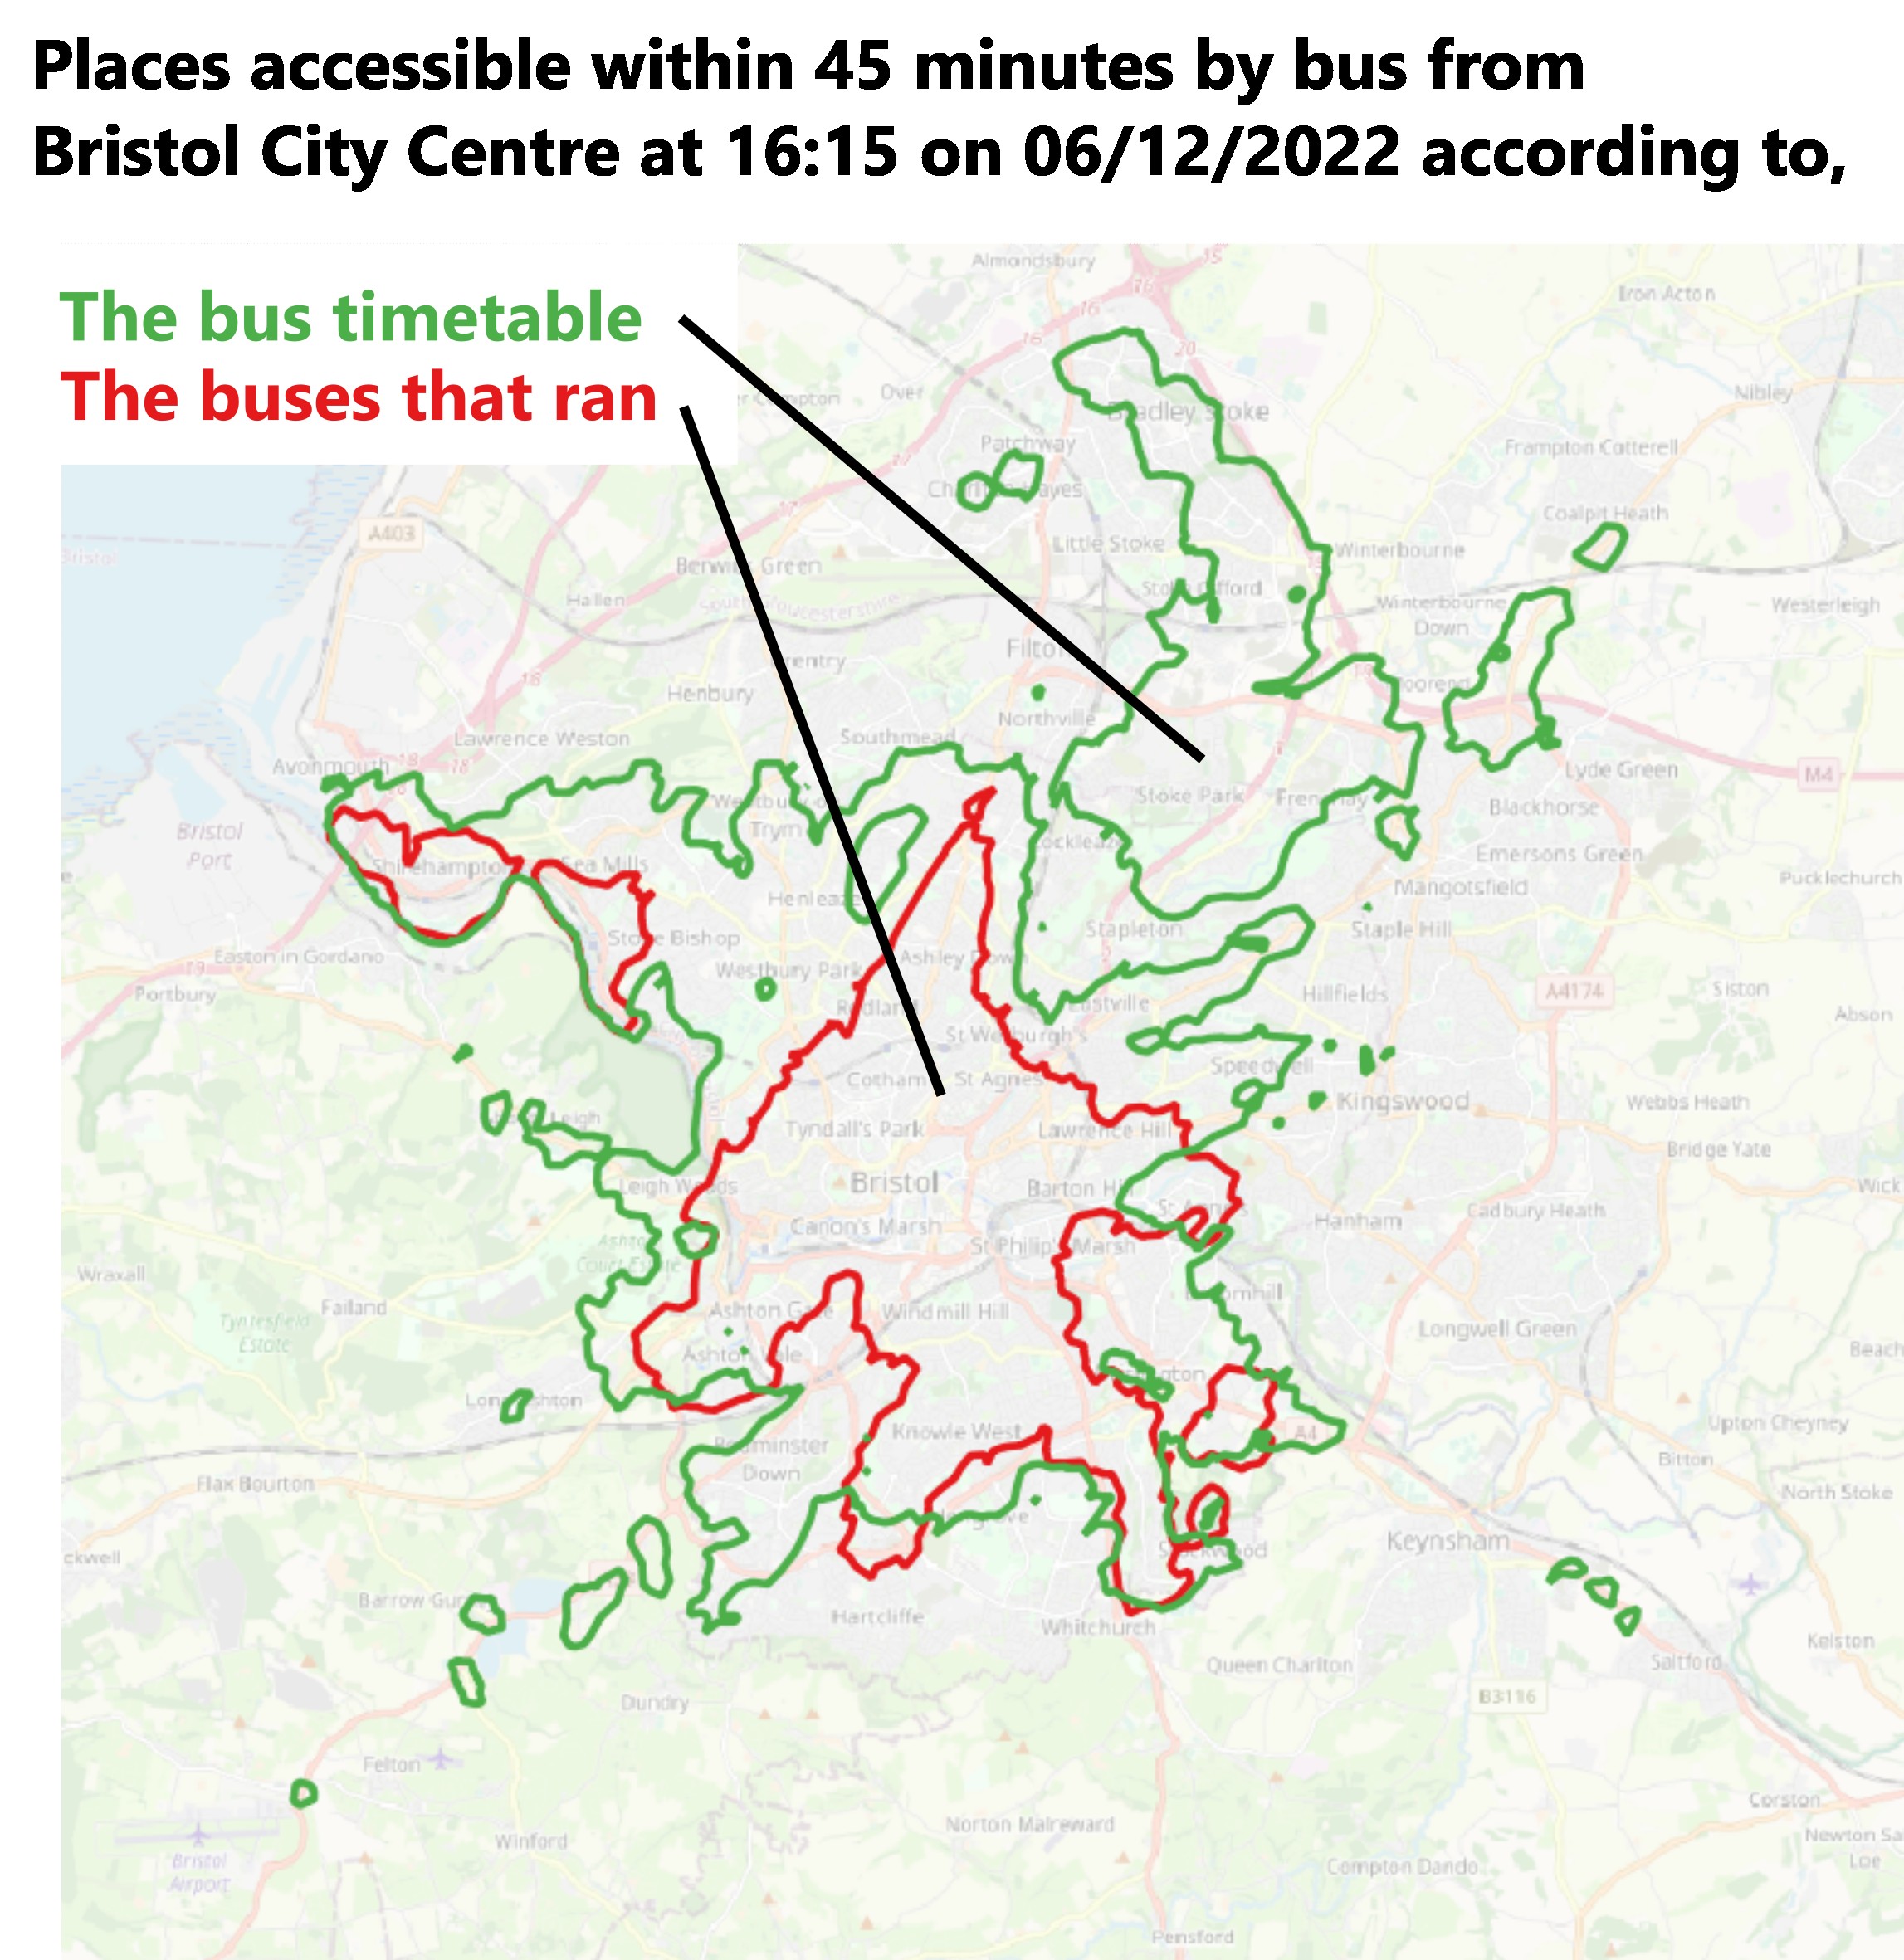
We found similar results in Bristol though without local knowledge we have chosen not to do any further analysis of what we found.
What next?
Our methodology considers the reliability of services across days and not just on a single day. We do this by creating maps for every weekday and taking the overlap of those boundaries. Since timetabled services are almost always the same every weekday this makes no difference to the accessibility maps for timetabled services. Since real services are much more variable this reduces the accessible area. In the example above for Leeds doing just three day intersection approach reduces the population of the boundary to 135 thousand.
We currently use the SIRI-VM feed for bus locations. This is in part because we have found it easier to work with and in part because we are concerned by “phantom buses” in the NextBus services of many cities, especially Leeds. We fear that these phantom buses are often caused by prediction errors that would make their way into the GTFS-RT feed and so we have avoided this.
But we know that our manual matching process between buses in the SIRI-VM feed has flaws. And we know that using the GTFS-RT standard will help us to expand our work abroad and work with others to improve our processes more rapidly. So in 2023 we will try to switch our analysis technique to GTFS-RT.
Another large problem with our process is that we currently only track buses, which is a major reason why I’ve only shared example output for Leeds and Bristol here. The real time location of trams, metros, and trains is not currently included within the Bus Open Data live location feed. This is a significant regression from our analysis using the Transport for the West Midlands API in 2017 and seems unlikely to be resolved this year.
It's taken us seven years to make significant progress on this and I expect that it will take another three years to reproduce what we did in 2017 in the West Midlands.
I know from experience that the lack of data on trains will lead most national institutions to reject our analysis, which is a shame. As so often I fear that the English demand for complex and nuanced national solutions leads to worse policy and leaves us considerably poorer than our European neighbours. My hope remains that if sufficient public transport powers can be devolved to local and regional government in the next three years we can get around these barriers to action and improve our society much more quickly. Let’s see.