Child poverty and university. Where in the UK is doing best?
The Sutton Trust have published a large report on Access in Scotland. It is critical of the methods I have used and is authored by a fantastic researcher.
IF WE DISAGREE IT IS MORE LIKELY THAT THEY ARE RIGHT THAN THAT I AM RIGHT.
Scotland's poor aren't going to University. England's are. That's what I've heard. Does the open data agree?
University in England costs up to £9000 per year, except for the very poorest students who pay nothing. In Scotland, at considerable expense to the Scottish government, University is free for everyone, except the English. The Scottish government's stated goal with this policy is to increase participiation, and yet there are increasingly loud and serious voices saying that the opposite has happened.
The Scottish Conservatives say that Scotland is by far the worst in UK at getting kids from the poorest families into university. The Economist note that the proportion of university students who come from the lower social classes is far lower in Scotland than in England: 27.9% compared to 31.4%. And John McDermott in his excellent piece "The SNP has failed Scotland" said, of Scotland's enviable historic record of educating the poor, that the legacy is fraying.
I accepted the arguments, and I changed my view on tuition fees from weakly against to weakly for. I probably still think that, but the data never felt completely right.
All the arguments about Scotland's performance seem to be based on data, initially from the Higher Education Funding Council for England (HEFCE) and more recently from the Universities and Colleges Admissions Service (UCAS). Specifically they rely on the participation of local areas (POLAR) classifications. The first problem with this data is that it doesn't seem to show what people are saying.
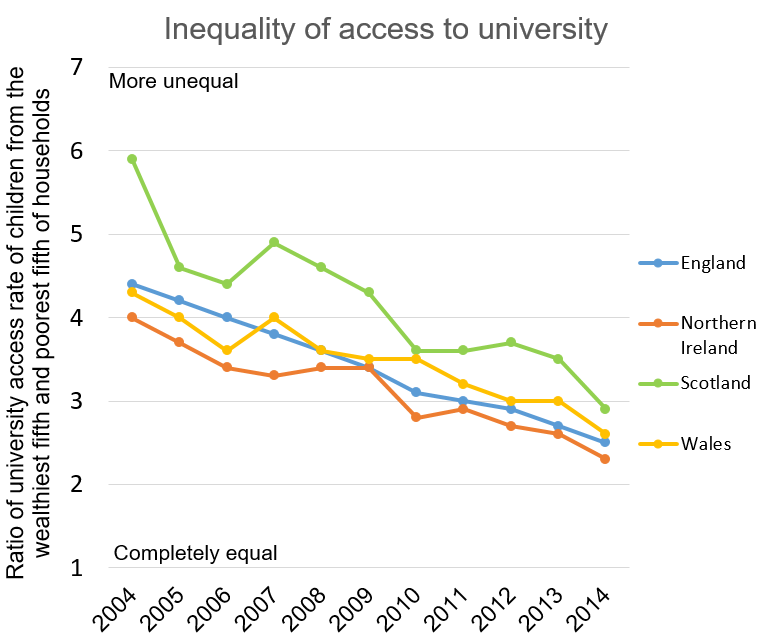
Scotland's inequality of access (the Q5:Q1 ratio, from data in the table below) does seem to be the highest of any UK nation, but over the past decade it has come down the most. This looks like success not failure to me.
The second problem is that these data are neither open, nor available at regional level. I've asked.
Hi @ucas_analysis. Do you produce a table like this one but with England broken down into regions? Thanks :) pic.twitter.com/3I4ePtUjGd
— Tom Forth (@thomasforth) August 17, 2015
Closed data is okay, until it starts to look wrong and you can't check it. Comparing England and Scotland without adjusting for the presence of the UK's capital in London is almost never sensible.
In the table above Scotland's university access rate is by far the lowest of all UK nations for the poorest fifth of children (Q1), but it is also by far the lowest for the richest fifth of children (Q5). This doesn't square with lots of other data showing that the university access rate in Scotland's cities, even the poorest, is exceptionally high.
I was determined to figure out what was wrong but history and devolution make comparing nations within the UK difficult. Most Scottish pupils take highers not A-levels and go to Universities (themselves defined slightly differently, which may flatter Scotland) aged 17, not 18 as in England. Deprivation is hard to compare across borders too, with subtle differences in the indeces of multiple deprivation for each UK nation. I needed a different method.
UK constituencies and child poverty.
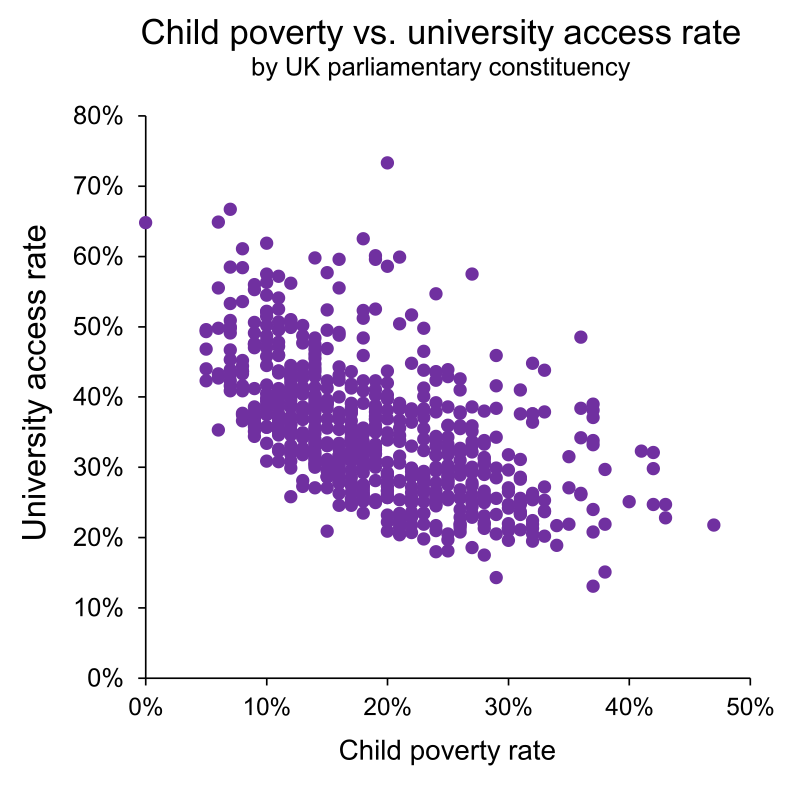
Both higher education participation rates and child poverty rates are available using standardised methods for parliamentary constituencies. Plotting them against each other for each constituency yields exactly the result we'd expect. Kids from rich families go to university more often than kids from poor families do.
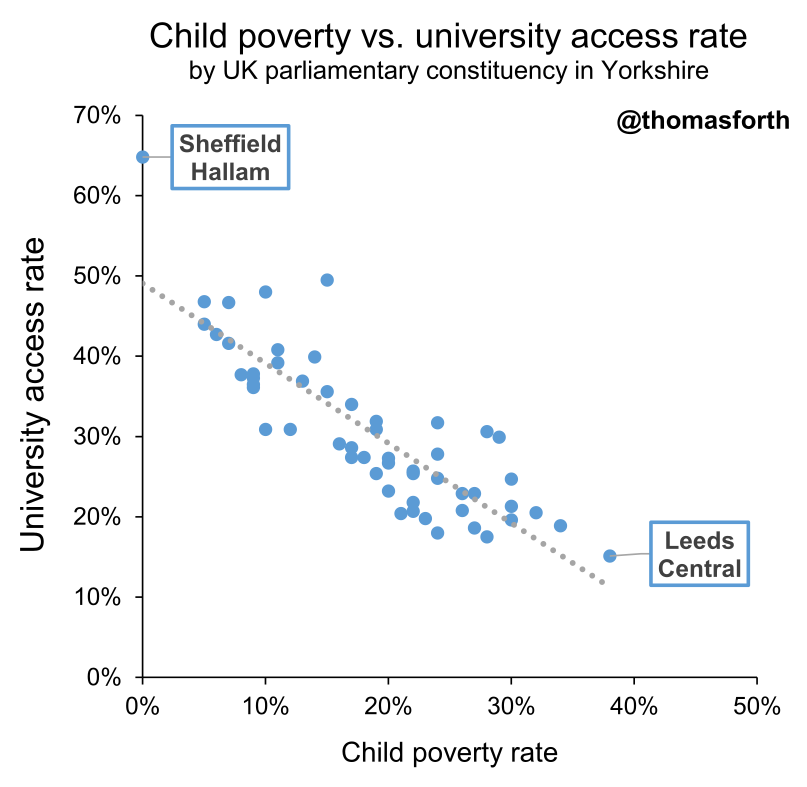
My technique lets me look at each English region and UK nation separately. The example below is for Yorkshire's 54 consituencies.
65% of children in Sheffield Hallam go to University, with 0% living in poverty. Meanwhile just 15% of children in Leeds Central go to University, with 38% living in poverty. Instead of taking quintiles and comparing them, we can use all the data available and calculate an inequality score by measuring the gradient of the line of best fit through the points.
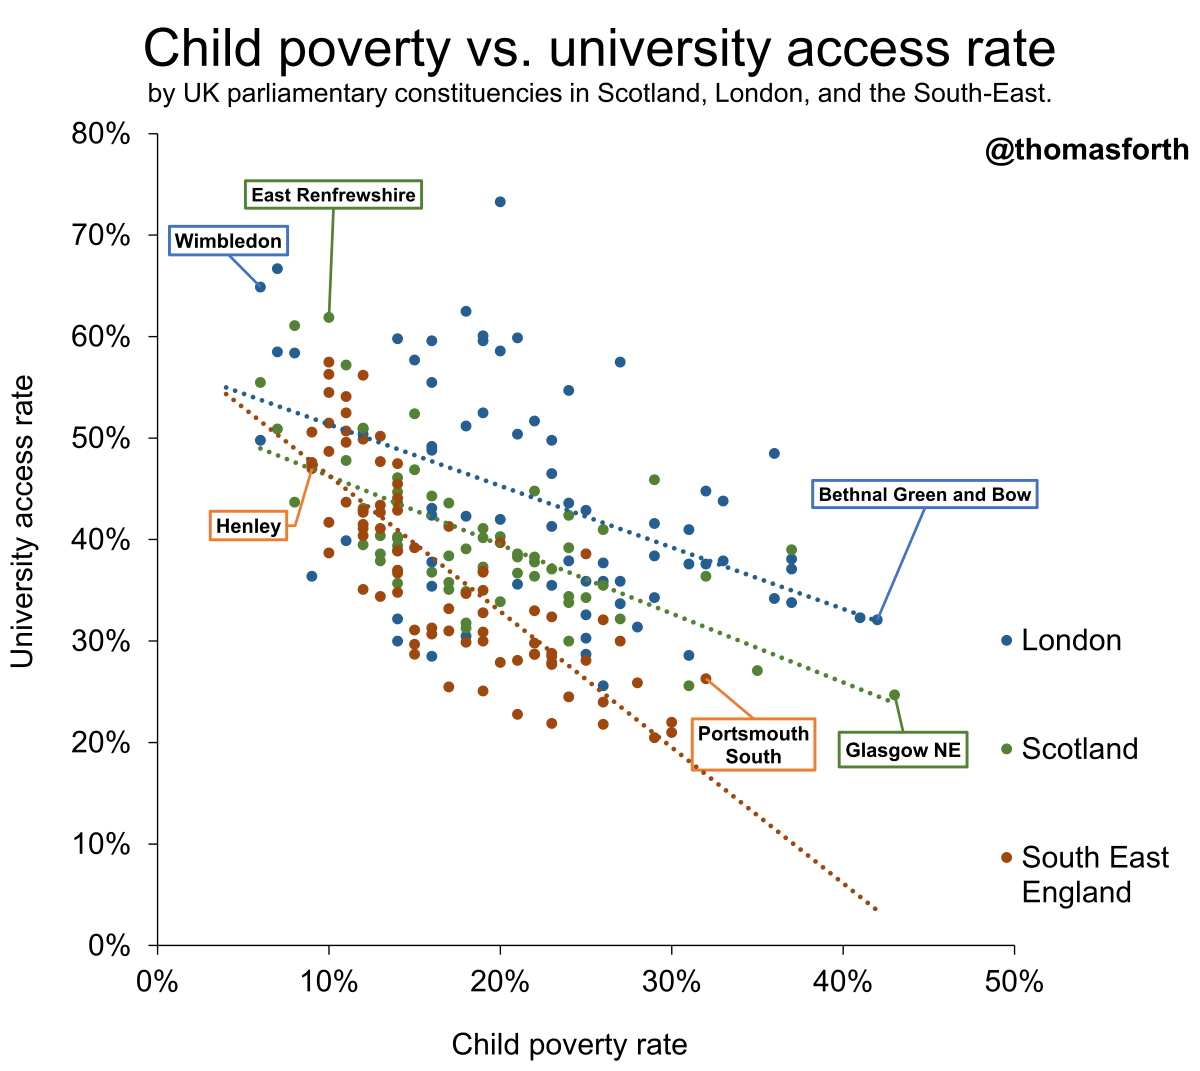
We now have a method to compare equality of access to university for different regions of the UK. In the graph below we see that the South-East of England has much less equality of access than London or Scotland.
My condensing inequality of access to university into a single number, we can compare the performace of all the UK's regions and nations.
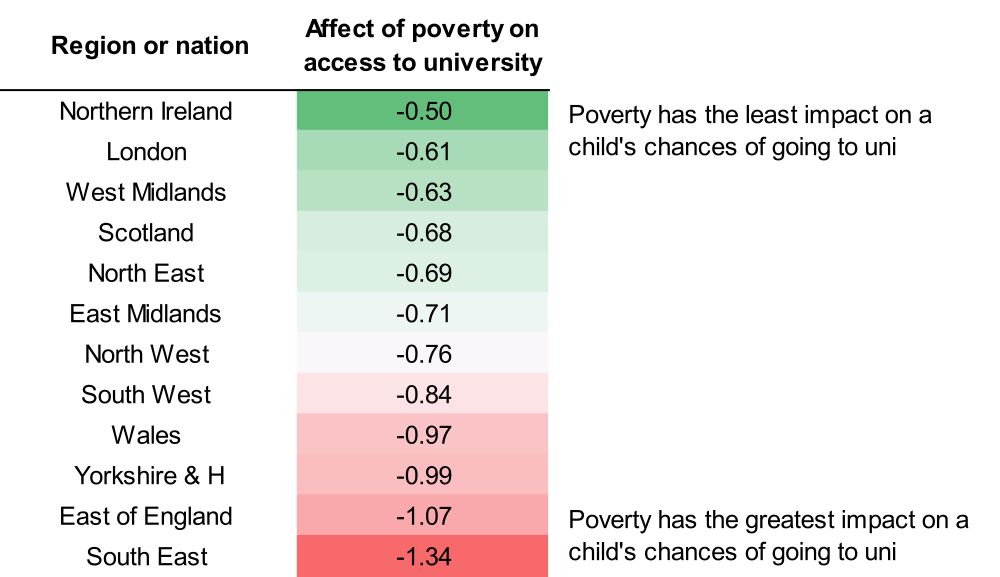
There must never be complacency in education, but combining Scotland's strong position in the table above with the evidence from my first graph showing its recent improvement I would argue that current criticism of its higher education system is unfounded.
There's a lot more I'd like to investigate, but I receive no income from this type of work and I can only do it in my spare time. My data and my workings are in this Excel spreadsheet. If you'd like to help my contact details are at the bottom of this page. I'd value both your opinions on, and any platform you can give to, this work.
Important problems and uncertainties.
The higher education access rate by constituency data that I use is the most recent available but it represents the decisions of people who turned 18 in the period 2005-2009 (the youngest of whom are graduating now and thus entering the dataset). This was before English tuition fees increased and before current worries about Scottish universities struggling with limited capacity and funding became loud. There are good reasons why I don't think that this affects my findings, but it may. I would of course love more up-to-date data but I do not think that the lack of it makes my analysis weak.
Another problem with my method is that constituencies are a very blunt geographical tool. It would be better to work with more fine-grained data but I don't have access to that. The obvious failings of the POLAR datasets that I criticise above makes me confident that this is not a reason to dismiss my findings.
Lastly, I'm not an expert in the UK's higher education systems. I went to a comprehensive school in East Yorkshire and did GCSEs, A-levels, and then a degree at age 19. The world of standards, highers, and University degrees awarded at higher education colleges is completely new to me. There's so much more I'd like to understand. Perhaps it's time for me to visit my Auntie and Grandma in Glasgow.